A/B Test Analysis + the Peeking Problem
Full statistical treatment of a mobile game A/B test, including a simulation of how much "checking daily and stopping early" inflates false positives.
p = 0.074
retention_1 (not significant)
p = 0.0016
retention_7 (significant)
21.6%
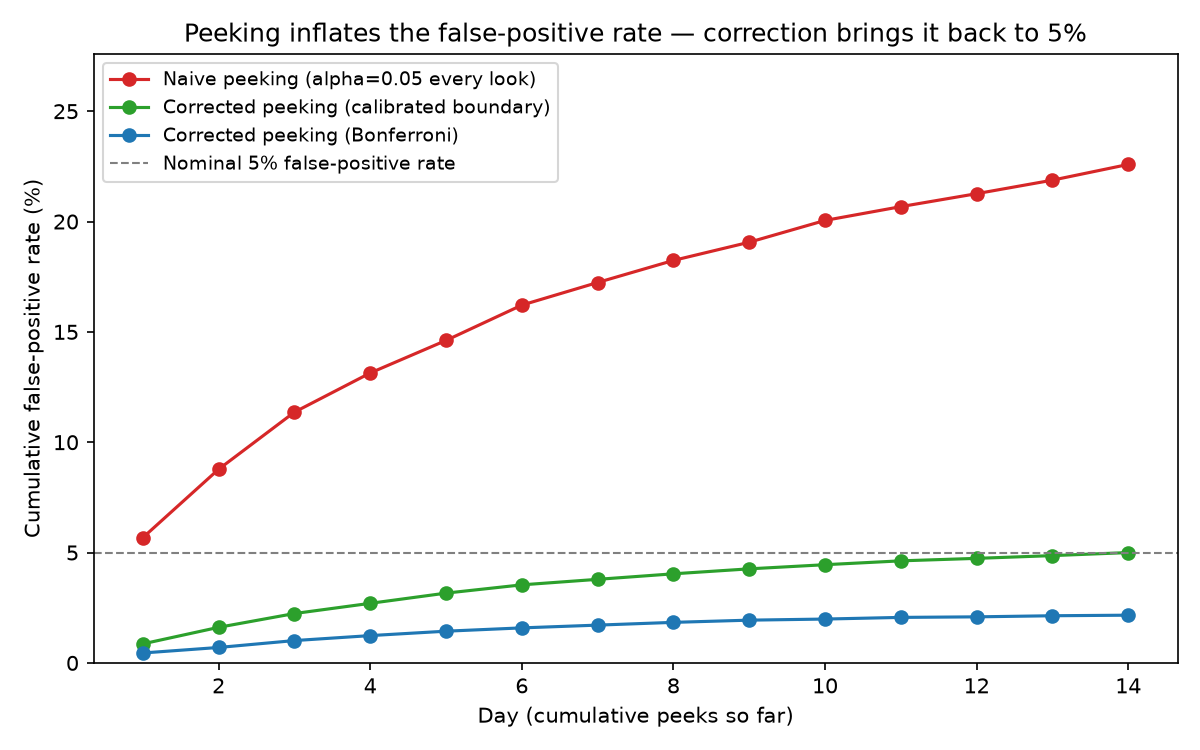
false-positive rate from daily peeking
5.0%
restored after correction
The peeking problem, visualized
A hypothetical: 8,000 simulated trials under the null hypothesis (no real effect), tested repeatedly over 14 simulated days. Naive peeking, stopping as soon as p<0.05, roughly quadruples the real false-positive rate above the nominal 5%. A simulation-calibrated significance boundary brings it back down.
The question
Cookie Cats moved its first progression gate from level 30 to level 40. Does that hurt player retention?
retention_1: gate_30 44.8% vs. gate_40 44.2%, diff 0.59pp, 95% CI [-0.06pp, 1.24pp], not significant
retention_7: gate_30 19.0% vs. gate_40 18.2%, diff 0.82pp, 95% CI [0.31pp, 1.33pp], significant, gate_40 is worse
Guardrail (game rounds played, outlier excluded): Mann-Whitney p = 0.051, borderline
Recommendation: don't ship the gate_40 change. No next-day benefit, and a real hit to 7-day retention.
retention_7: gate_30 19.0% vs. gate_40 18.2%, diff 0.82pp, 95% CI [0.31pp, 1.33pp], significant, gate_40 is worse
Guardrail (game rounds played, outlier excluded): Mann-Whitney p = 0.051, borderline
Recommendation: don't ship the gate_40 change. No next-day benefit, and a real hit to 7-day retention.
Why this exists
Full write-up, including the power calculation, guardrail methodology, and what the peeking correction is actually doing, is in the repo README and the executable notebook.